Across all product and services categories, ad investment is shifting heavily into Internet formats, while there are two specially reluctant to do it, Food and Soft Drinks, who still devote around two thirds of their ad investment to TV.
These are some insights derived from the new WARC Data, relaunched today by WARC, now on in collaboration with Nielsen.
The move to online advertising is particularly stark within Financial Services and Retail. Both sectors have developed digital platforms to serve their customers in recent years.
McDonald: Finding optimal media mix is key, despite the high level of wasted investment online

James McDonald, Managing Editor, WARC Data, and author of the research, comments: “In a multichannel world, it has become harder than ever to track campaign performance, measure ROI, or to even trust third-party data. Additionally, the problem is compounded by an environment of ad blocking, fraud, and consumer distrust, and is hazed by walled gardens, programmatic stacks and opaque practice. This results in millions of ad dollars wasted each year.
“But it is essential that ad investment works harder in the media mix to obtain optimal reach and effectiveness. As such, our latest research into product category insights provides vital data to help brand owners, agencies and media strategists and planners inform their decision making.”
The improved WARC DATA provides a new industry-standard measure of net advertising investment data across 19 product categories in 23 markets, including the United States, United Kingdom and China.
In WARC’s latest ‘Global Advertising Trends – Benchmarking ad investment by product category’, the industry intelligence included in the report sheds light on how different sectors value advertising media, and how this has changed over time.
Key findings for five of the 19 product categories available include, among others, the following shared below.
Key findings for Financial Services
Total global adspend by companies in the Financial Services sector in 2018 reached the $43.2Bn (+13.0% year-on-year). Median revenue ROI for successful campaigns: 2.93
The split by Media was: Internet $19.7bn (+24.4% year-on-year). TV $12.9bn (+4.0%). Radio $3.7bn (+5.1%). Other $7.0bn (+6.7%).
Ad/sales ratios were: Financial services (3.6%). Banks, credit, loans (6.7%). Insurance (0.8%). Investment (1.5%).
Close to half of the $43.2Bn financial services brands invested in advertising last year was directed towards internet formats. The data show a dramatic shift to digital over the last five years.
internet’s share of sector spend has grown 22.0 percentage points (pp) since 2013, to 45.5% last year. This is just above internet’s share of global adspend (44.1%). As a share of sales revenue, the sector spends 3.6% on advertising, rising to 6.7% among banks.
Key findings for Retail
Total global adspend by companies in the Retail sector in 2018 totalled: $62.3Bn (+0.0% year-on-year). The median revenue ROI for successful campaigns stood at 4.40.
The split of the investment by Media was: Internet $21.5bn (+9.1% year-on-year). TV $20.3bn (-0.6%). Print $9.6bn (- 15.5%). Other $10.9bn (+0.8%).
Ad/sales ratios: Retail 2.3%; Clothing & fashion (2.9%); Restaurants (2.0%) and Supermarkets (1.2%).
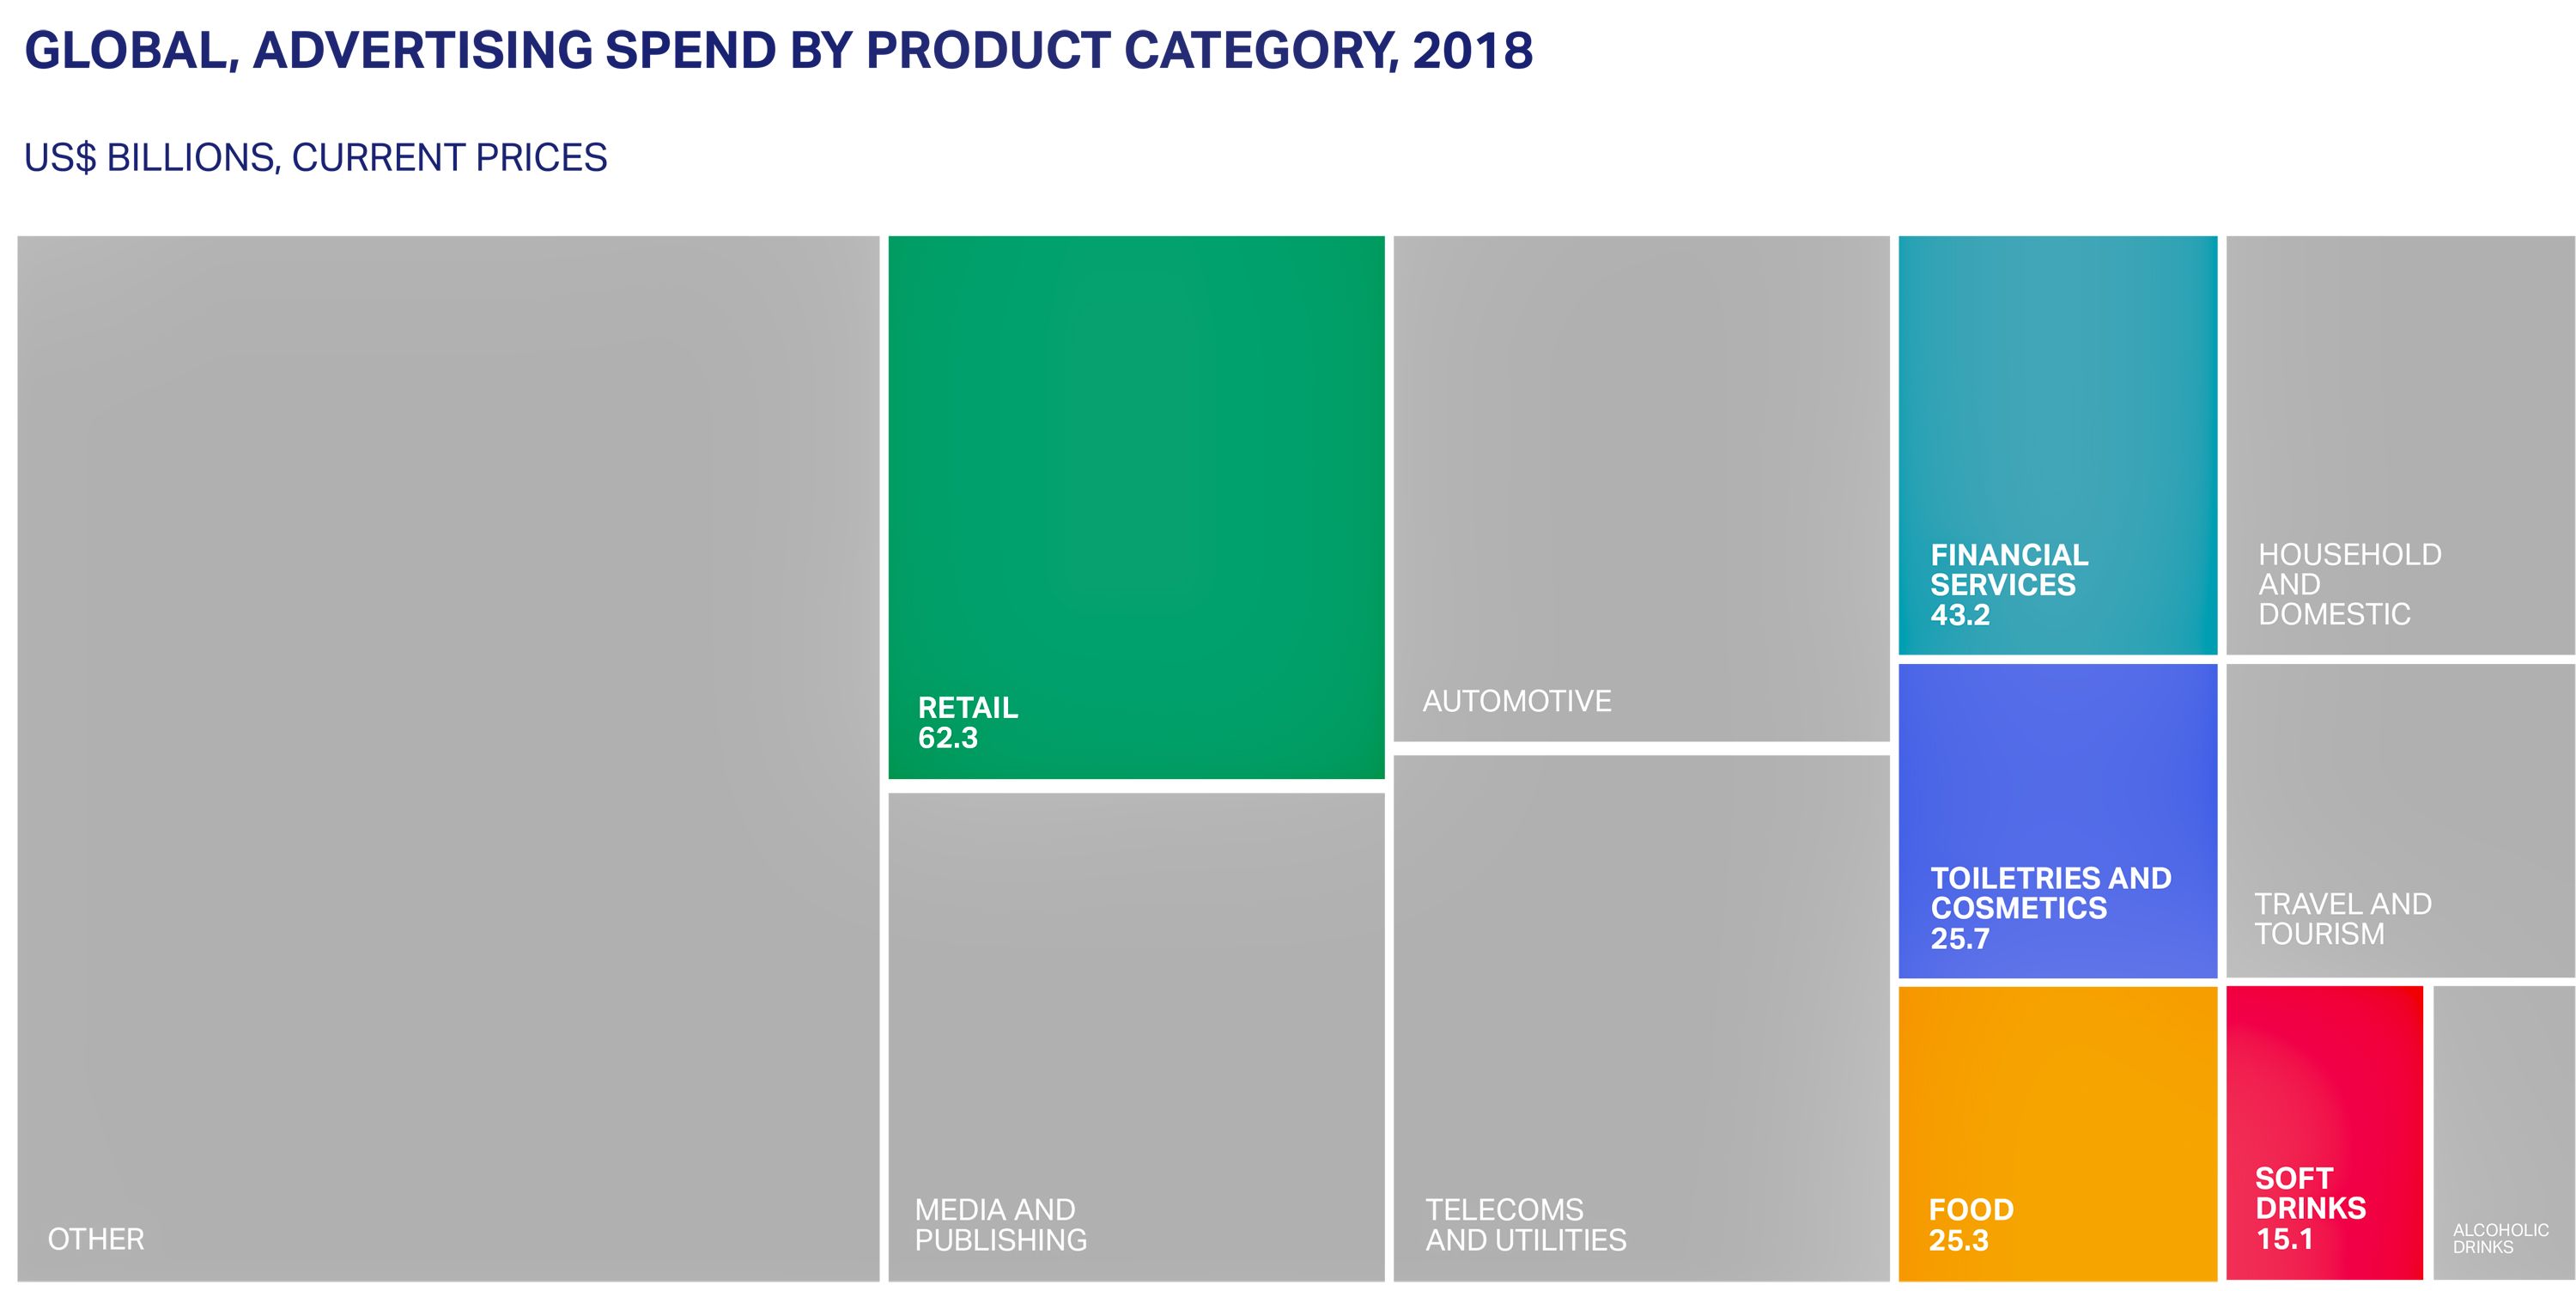
Global advertising spend in the retail sector was flat in 2018 at $62.3bn. The $1.8bn in extra internet spend (up 9.1% from 2017) was offset by a decline in spend for all other media bar out of home (+12.7%) and cinema (+4.9%). Ad investment among the retail sector has tracked downwards in recent years, recording a compound annual growth rate of -1.8% since 2013. However, online advertising has become far more valuable to the sector during this time.
Key Findings for Food
Total global adspend by Food companies in 2018 reaced the $25.3Bn (+1.4% year-on-year). The median revenue ROI for successful campaigns scored 2.93.
The split of total investment by Media was: TV $16.5bn (+1.0% year-on-year). Internet $3.7bn (+7.9%). Print $2.8bn (- 12.7%). Other $2.3bn (+15.3%)
The Ad/sales ratios: Food (2.6%). Confectionery (5.6%). Dairy (0.6%). Meat, fish, poultry (0.7%).
Almost two-thirds of the $25.3Bn in ad investment within the food category last year was spent on TV, nearly double TV’s global share of 33.3%. TV spend in the sector rose 1.0% year-on-year to $16.5Bn in 2018 but has dipped by 3.7% each year since 2013 on a compound basis. Print also accounts for a greater share of food adspend than is the case globally, with newspapers’ (- 2.6pp) and magazines’ (-2.1pp) share dipping mildly over the last five years.
Key findings for Soft Drinks
Total global adspend in 2018 made by companies operating in the Soft Drinks sector was $15.1Bn (+1.1% year-on-year). The median revenue ROI for successful campaigns stood at 2.84.
The split of total spend by Media was: TV $10.5bn (+1.1% year-on-year). Internet $1.9bn (+28.3%). OOH $1.3bn (- 24.1%). Other $1.4bn (+1.3%).
Ad/sales ratios by category shows: Soft drinks (5.9%); Bottled water (5.9%); and Carbonated (5.9%).
At 70.0%, TV’s share of soft drinks brands’ adspend is higher than all other categories studied for the report. The $10.Bn spent on TV ads in 2018 was up 1.1% from 2017 and has grown at a compound rate of 2.0% each year since 2013, bucking the global trend.
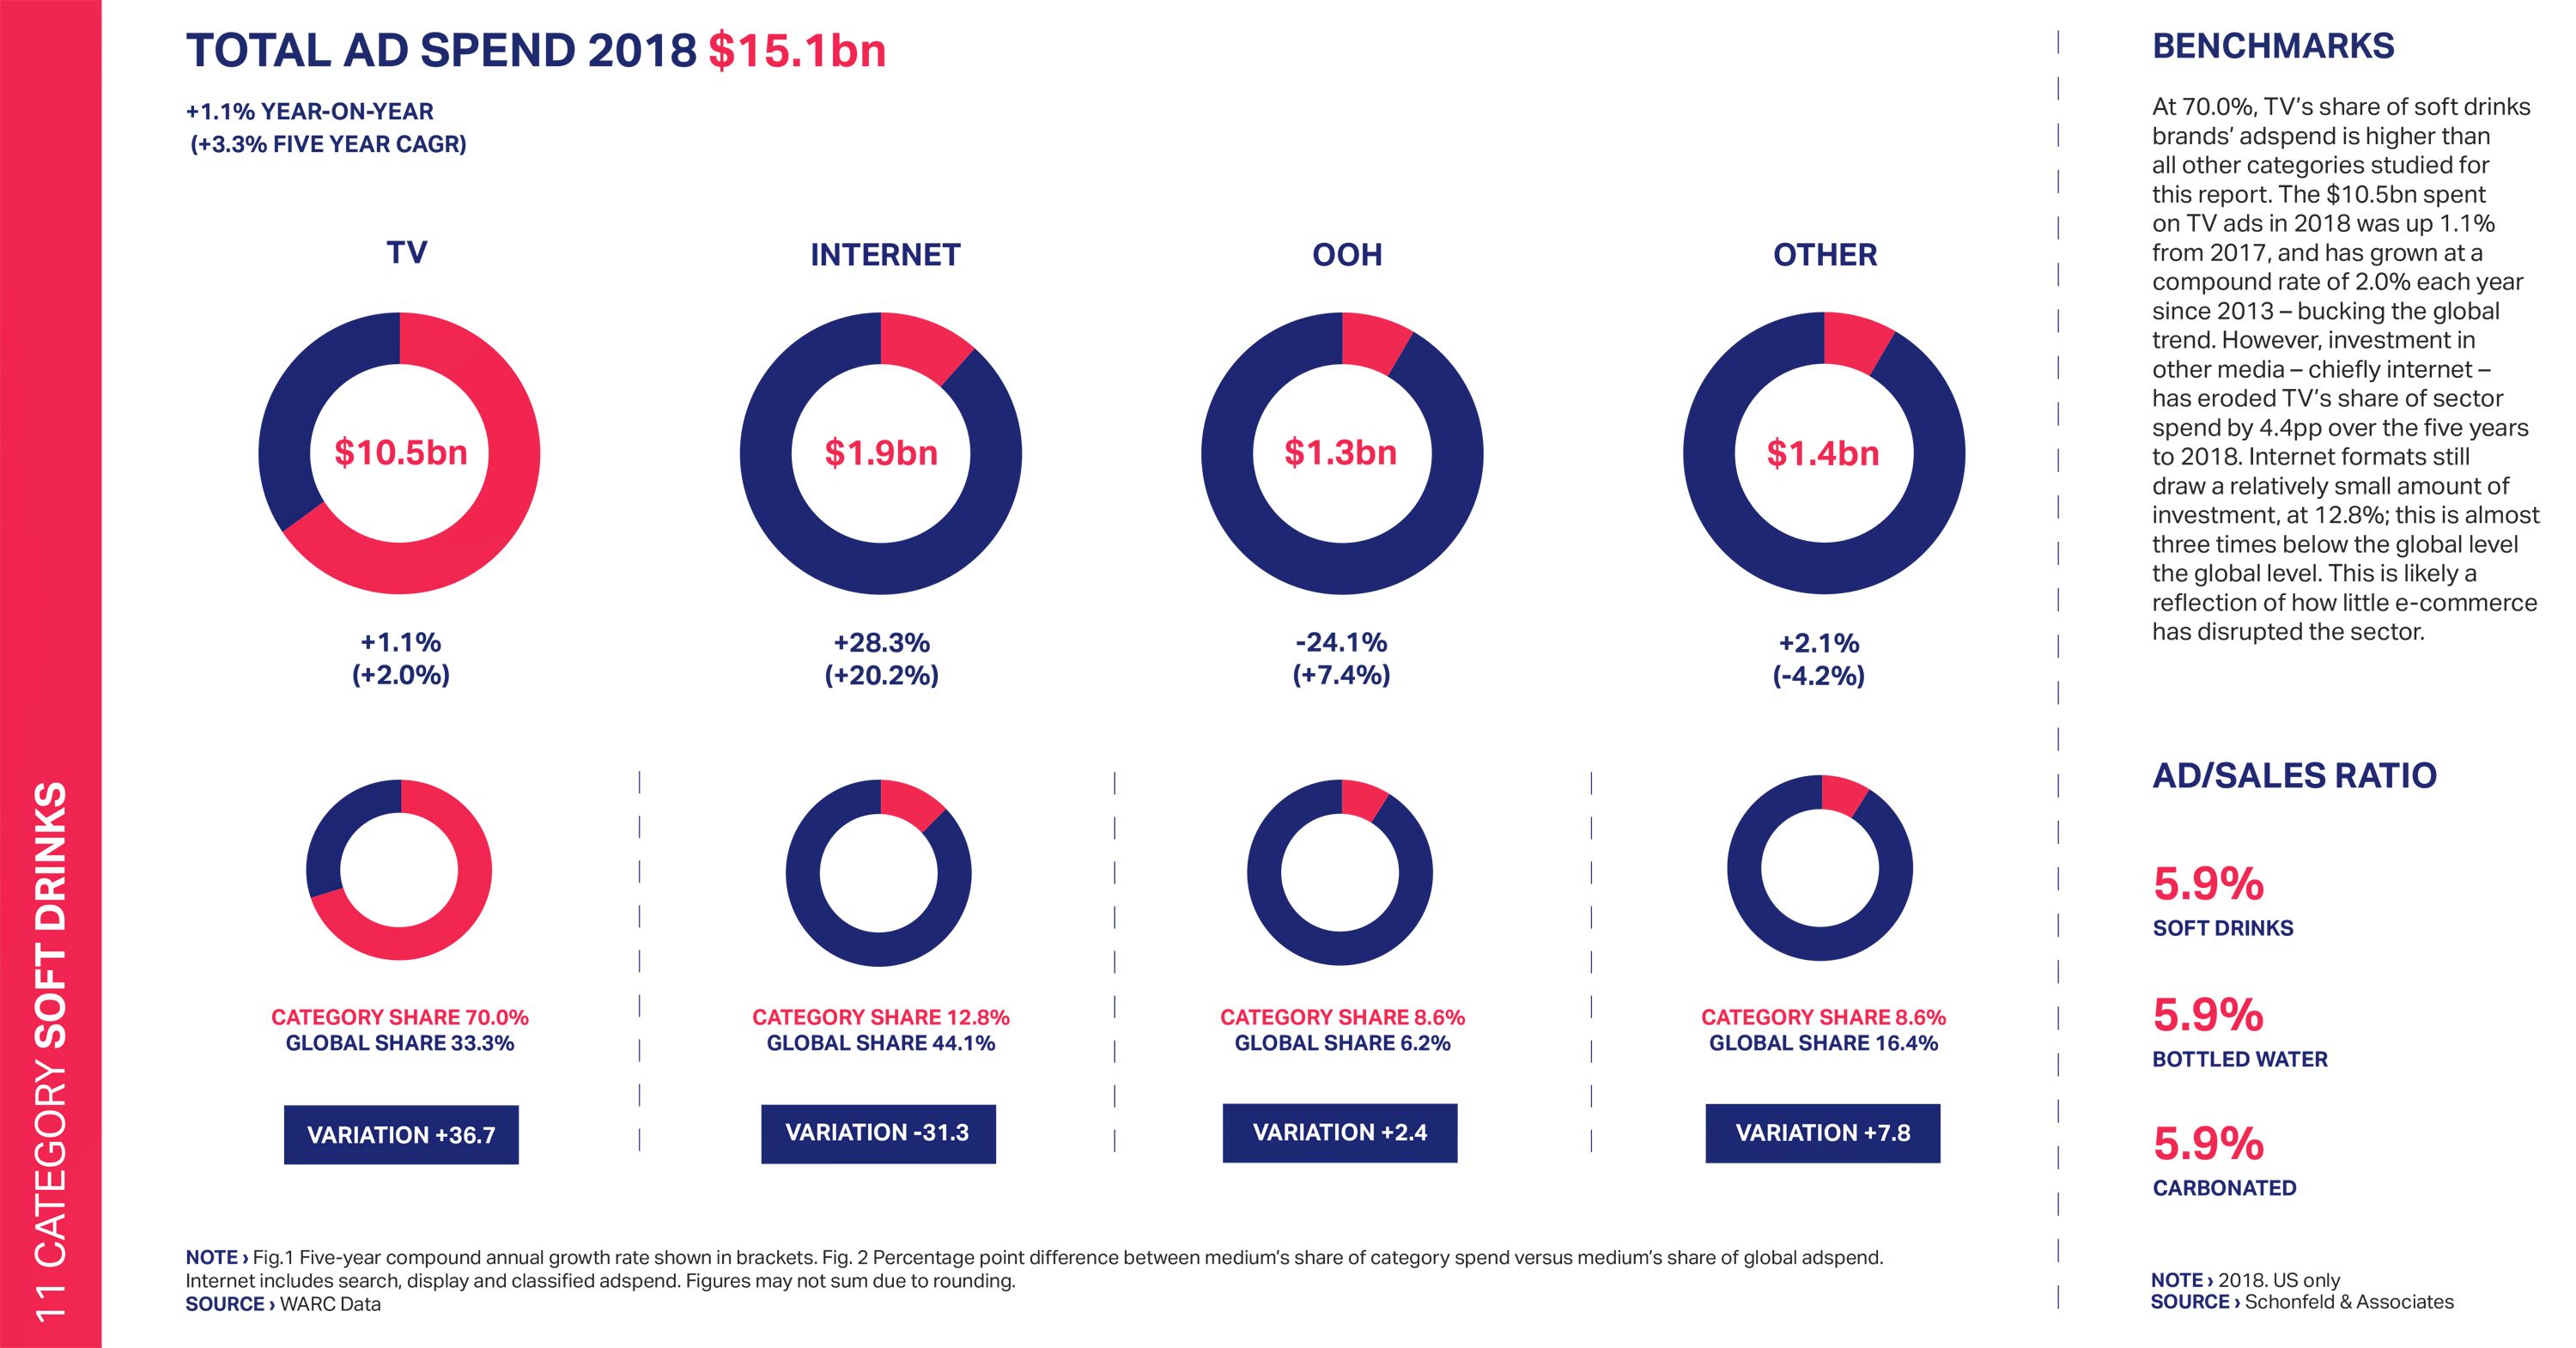
However, investment in other media (mainly Internet) has eroded TV’s share of sector spend by 4.4pp over the five years to 2018. Internet formats still draw a relatively small amount of investment, at 12.8%; this is almost three times less than the global level and is likely a reflection of how little e-commerce has disrupted the sector.
Key Findings for Toiletries & Cosmetics
Global adspend in 2018by the companies operating in the Toiletries & Cosmetics sectors totalled $25.7Bn (-3.6% year-on-year). The median revenue ROI for successful campaigns was 2.06
Global ad spend in this sector by Media was: TV $14.9Bn (-3.9% year-on-year); Internet $5.6Bn (+9.7%); Print $2.9bn (- 12.0%); and Other $2.3Bn (-15.9%).
The Ad/sales ratios stood at: Toiletries & costmetics (16.9%); Bath toiletries & soaps (12.3%); and Fragrances (21.5%).
At a top line level, ad investment within the toiletries & cosmetics sector has dipped 4.1% each year since 2013 on a compound basis, to a total of $25.7bn last year. This is largely due to how this spend has been allocated historically: in 2013, TV accounted for two-thirds of adspend while print drew a further fifth. Both of these media have recorded declining spend over the period, with internet (+10.7pp) and out of home (+4.7pp) gaining most in share but from a low base – depressing total investment growth in recent years. Print still accounts for 11.4% of sector spend, with magazines alone worth over $2bn, but this total has more than halved since 2013.
WARC’s Global Ad Trends, an analysis of key advertising and media investment trends drawing on WARC’s entire range of market data, is published monthly with a different focus for each edition to take a holistic view on current industry developments.
Image over the headline.- © WARC
Related external links: